abstract.
In this lab the diode, a simple non-linear device in a circuit was explored by exploring the difficulties inherent in characterizing and working with it. Three models for the circuit element were explored: real, ideal, and model diode.
Diode Exploration
Calculating Is and n
The common model used to characterize the diode is given by the Shockley diode equation shown below.
The current-voltage relationship is dictated by the following parameters:
q is the charge on an electron
v is the voltage across the diode
n is the emission coefficient, usually between 1 and 2
k is Boltzman's constant
T is the absolute temperature
Is is the saturation current
Is and n are values obtainable by experiment by measuring voltage and current. Two diodes—1N4001 and 1N914—were chosen diodes for the characterization experiment.
Figures 1 and 2 show the experimental voltage-current curves for the two diodes of interest. m1 is the fit value for I s and m2 is the fit value for n. As shown in the exponential fit, the values are well within reason considering the uncertainty in the manufacturer’s specified values. The value of n should be between 1 and 2, and is true for the 1N4001 diode but not for the 1N914. The value for the latter diode, however, has a significant error (.303) associated with it.
Figure 1. Voltage-Current Curve for 1N914 Diode.
Figure 2. Voltage-Current Curve for 1N4001 Diode.
Comparing our experimental I s values to the ones given by the manufacturer’s indicates that it is a difficult parameter to predict accurately. It is important to note that the data for the voltage-current plots from which the two diode parameters were obtained were recorded using an oscilloscope that is only accurate to a certain degree. However, I s and n values obtained were reasonable.
Task 2: Comparing the Real, Ideal and Shockley Model for Diodes
A simple circuit with the 1N914 diode in series with a 1kOhm resistor was built. Using an AC source of 2V at 2 kHz, we looked at how Vout changed relative to Vin by considering the three diode models. Figure 3 below shows the experimental output Vin and Vout after the diode.
Figure 3. Experimental Vout and Vin
The diode is clipping for the negative voltages of the sinusoid, and a voltage drop is existent. The three diode models were used to model the diode clipping and voltage drop shown in Figure 4.
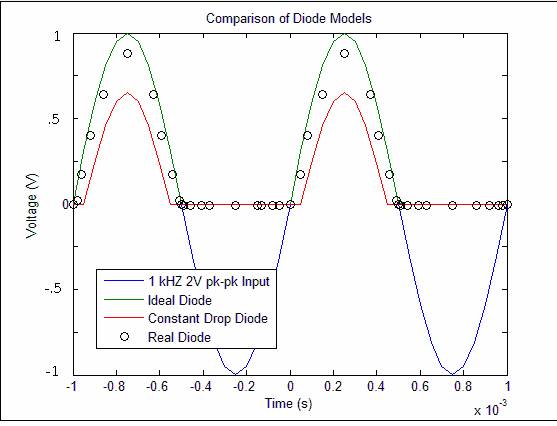
Figure 4. Comparison of Diode Models
For the ideal diode model, there is no diode voltage drop for positive input voltages, so Vout is clipped at 0 for the negative part of the sinusoid. The Shockley Model for diodes assumes a .7V across the diode, so Vout is .7 volts below the input signal at all times.
We found the value for Vdiode using a graphical method using the two equations shown below. By using the Shockley diode model and writing the Kirchoff loop expression for i in a circuit in which the diode was in series with a 1kOhm resistor, we can solve the two for Vdiode.
 and and 
Using the known values for k, T and q as well as calculated values for Is and n for the 1N914 diode, we obtained graphs of both equations for i as a function of Vdiode. The intersection point yielded the value for Vdiode and the corresponding i value. Graph 3 shows an example of our graphical method.
Figure 5. Example of the graphical method used to find the right Vdiode values.
In this case, Vin = 2V produced Vdiode = 0.24 V and i = 1.78e-3 A. Repeating for a range of voltage values between -2 V and +2 V, values for Vdiode and i were obtained.
| Circuit 2 Data |
| Vin |
Vdiode |
Idiode(mA) |
Vout (V) |
2.00 |
0.24 |
1.78 |
1.76 |
1.50 |
0.22 |
1.30 |
1.28 |
1.00 |
0.20 |
0.81 |
0.80 |
0.50 |
0.16 |
0.35 |
0.34 |
0.10 |
0.06 |
0.04 |
0.04 |
0.00 |
0.00 |
0.00 |
0.00 |
-0.10 |
-0.09 |
-0.02 |
-0.02 |
-0.50 |
-0.48 |
-0.02 |
-0.02 |
-1.00 |
-0.98 |
-0.02 |
-0.02 |
-1.50 |
-1.48 |
-0.02 |
-0.02 |
-2.00 |
-1.98 |
-0.02 |
-0.02 |
Table 1. V diode and I diode for various input voltages
Considering the three different models, the constant drop diode model (Figure 4) matches the experimental data best (Figure 3). It clips for negative voltages as the diode is reversed-biased and has approximately the same output amplitude.
conclusion.
Modeling and characterizing the diode is tricky due to its non-linear relationship between current and voltage. Obtaining the correct Is and n parameters for the real diode is important to accurately model its non-linear behavior, and is a limitation to applying it in the circuit for Task 2. The constant drop diode model works best from what we have found.
|