"And, of course, when you discover something like that and it's like discovering a tooth with a missing filling. You have to probe it, work around it, push on it, think about it... Not to deliberately irritate [it], but because the irritation seems symptomatic of something deeper, something under the surface that isn't immediately apparent."
–Rob Pirsig, Zen and the Art of Motorcycle Maintenance
1. Abstract.
For this lab we tested the performances of 5 different processors (p3, p4, g4, g5, UltraSparcII) on various tasks and observed some properties (ie, endianness, how they create random numbers)
In particular, we observed the effects of cache and
superscalar processing on system performance. (lab instructions)
2. Testing.
2.1 EndiannessTo check endianness of memory, we created a long integer data type and put a constant hex value into it. By using a pointer we looked into the leftmost bytes, if those bytes were the most significant then our processor used big endian memory, if they were the least significant then our processor used little endian memory.
Consider the hexadecimal number A0B1C2D3 where every letter/number represents 4bits.
in a small-endian machine, the number is stored in memory as D3 C2 B1 A0 (namely the order of bytes of a 32bit data are in backwards order but the bits in the bytes are in right order). in a big-endian machine, the order is A0 B1 C2 D3. Although there are no significant differences between the two architectures now, big-endian machines were optimized for comparisons, and small endian machines were optimized for mathematical operations. Here are the results of our tests:
Part 1 |
|
Processor |
Endianness |
P4 |
Small endian |
P3 |
Small endian |
G4 |
Big endian |
G5 |
Big endian |
Ultrasparc2 |
Big endian |
2.2 Cache properties
We found information about the cache structure of different processors on the producer websites, hardware review websites etc. The following data is exactly the numbers our test algorithms used. (Google is the best thing that's ever happened to us)
Part 2 |
(Numbers used for actual tests) |
Processor |
L1 Cache Size |
L2 Cache Size |
L1 Linesize |
L1 # Lines |
L1 Mapping |
L2 Mapping |
P3 |
16384 |
262144 |
32 |
256 |
4-way SA |
8-way SA |
P4 |
8192 |
524288 |
32 |
256 |
4-way SA |
8-way SA |
G4 |
8192 |
524288 |
32 |
1024 |
8-way SA |
8-way SA |
G5 |
32768 |
524288 |
31 |
1024 |
2-way SA |
8-way SA |
Ultrasparc2 |
16384 |
262144 |
31 |
512 |
2-way SA |
Direct |
Sizes in bytes |
|
|
|
|
|
|
2.3 Cache Access Stress
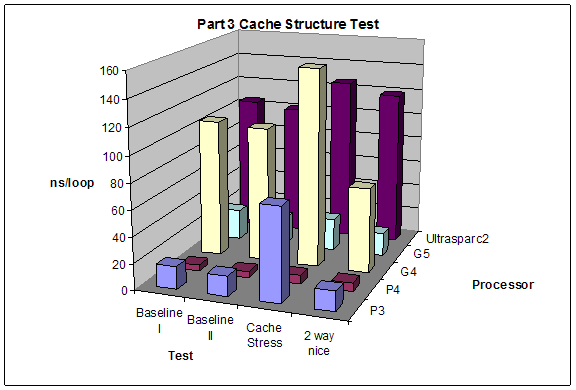
We conducted 4 different tests in this part. For each we created an array to allow to access different parts of memory. While looping through the array we had a separate index counter from the index of the loop that we manipulated to get the jumps around memory we wanted. The tests we conducted were:
1. Baseline I: access each byte of a cache-sized block of memory in order.
2. Baseline II: access the first byte of each line of cache of a cache-size block of memory in order.
3. Cache Stress: force cache misses on every access. You can do this by accessing the first byte of each line of a block of memory that is at least twice the size of the cache. Then every access must displace an old line of cache.
4. 2-way Nice: access memory in such a way that a 2-way set associative cache would not miss, but a direct mapping will always miss.
Expectations:
We expect that baseline 1 and baseline 2 tests will yield about the same performance. The cache stress test will result in the worst performance since it forces access to the L2 cache. The 2-way nice test will give results similar to baseline 1 and baseline 2 on processors with n-way set associative L1 cache, otherwise it will give results similar to the cache stress test.
Results:
We were unable to see any significant changes in access time for G5 when we stressed the cache. Also G5 and G4 had better performance on 2-way nice tests then baseline 1 and baseline 2. Other than these things the results were as expected.
Part 3 |
|
|
|
|
Processor |
Baseline I |
Baseline II |
Cache Stress |
2-way nice |
P3 |
17.2 |
15.4 |
71.4 |
15.1 |
P4 |
4.5 |
4.7 |
7 |
6.3 |
G4 |
105.7 |
103.8 |
152.2 |
65.1 |
G5 |
23.4 |
21.9 |
24.7 |
17.7 |
Ultrasparc2 |
105.3 |
101.2 |
126 |
118.8 |
2.4 Matrix Access
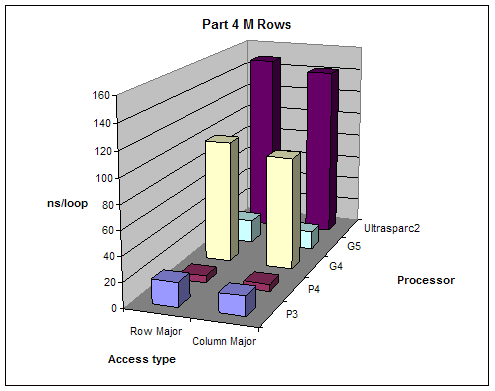
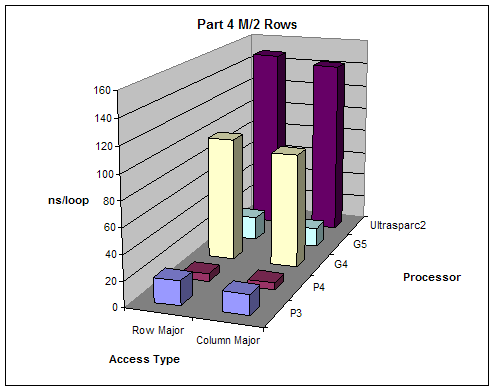
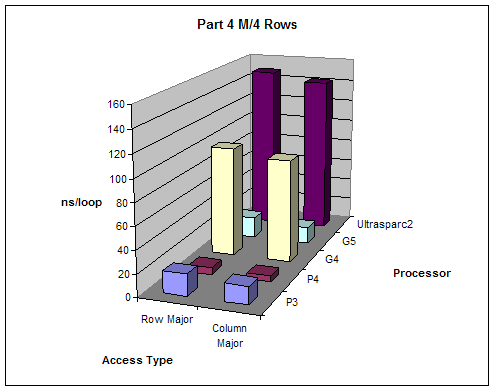
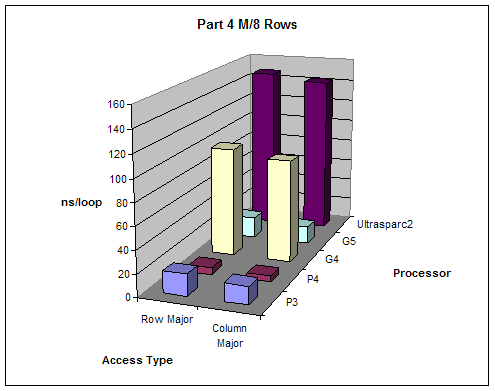
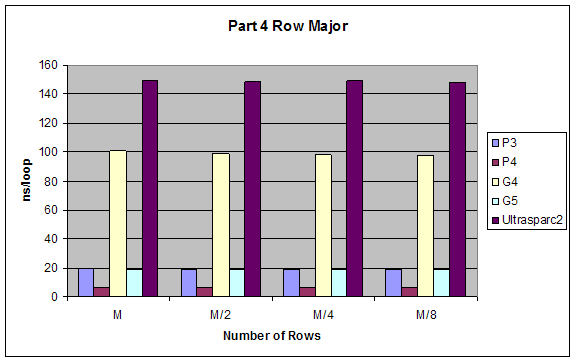
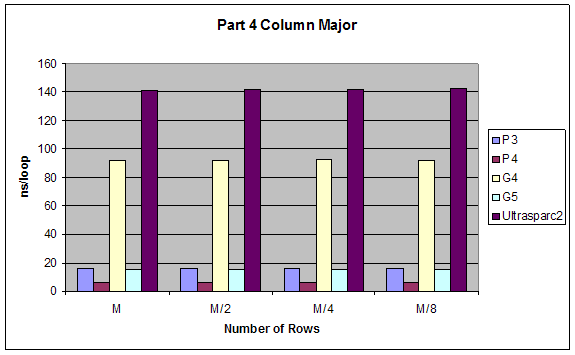
We created varying size 2 dimensional matrices and accessed them in different ways and measured performance. The number of columns of our matrices was fixed to 8 and we did different test with number of rows equal to M, M/2, M/4, M/8 where M is the size of the L1 cache. We tested the performance accessing the matrix row-major order (loop of columns inside loop of rows) and column-major order (loop of rows inside loop of columns).
Expectations:
Given that 2-dimensional matrices are stored in memory row-major order, accessing them column major order will give better performance since it will allow sequential memory access without jumping back.
Results:
All results are as expected
Part 4 |
|
|
|
|
|
|
|
|
|
M |
|
M/2 |
|
M/4 |
|
M/8 |
|
Processor |
Row Major |
Column Major |
Row Major |
Column Major |
Row Major |
Column Major |
Row Major |
Column Major |
P3 |
19.5 |
15.9 |
19.3 |
15.9 |
19.3 |
15.9 |
19.3 |
15.9 |
P4 |
6.1 |
5.9 |
6.1 |
5.8 |
6.1 |
5.8 |
6.1 |
5.8 |
G4 |
100.4 |
92 |
98.9 |
91.7 |
98.4 |
92.2 |
97.8 |
92 |
G5 |
19.1 |
15.1 |
19.1 |
15.5 |
19 |
15.3 |
19 |
15.5 |
Ultrasparc2 |
148.9 |
141.6 |
148.5 |
142 |
148.9 |
142 |
147.8 |
142.6 |
Units: ns/loop |
2.5 Arithmetic on Floating Point and Integer Values
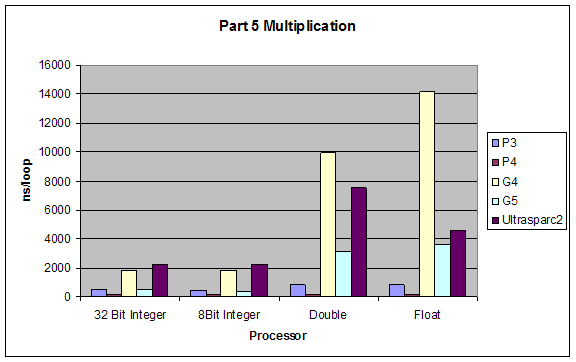
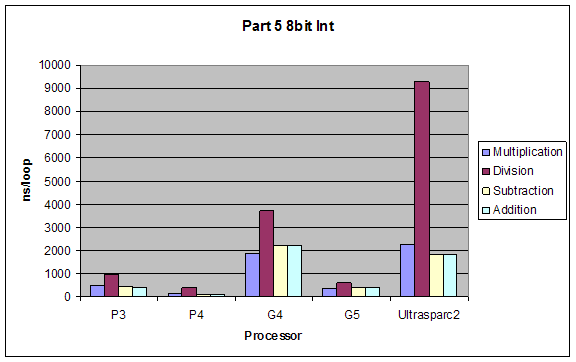
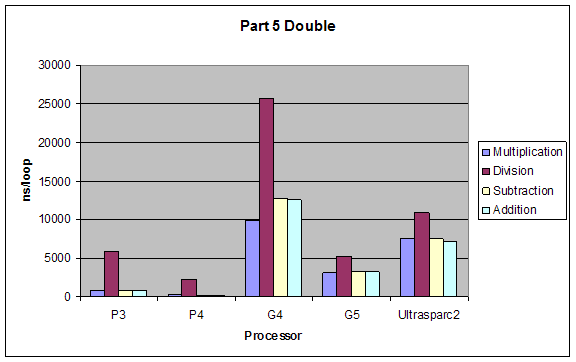
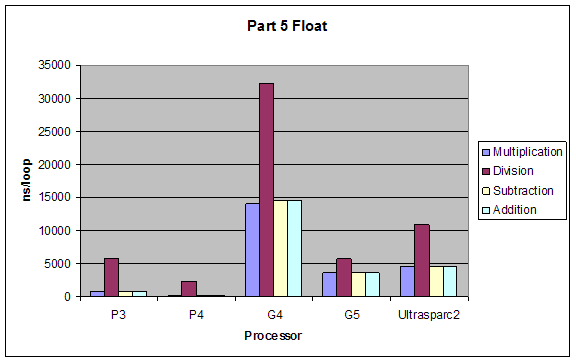
We tested performance in doing simple arithmetic (*, /, -, +) on 8-bit and 32-bit integers, single and double precision floating point numbers.
Expectations:
The performance of operations would be (better to worse):
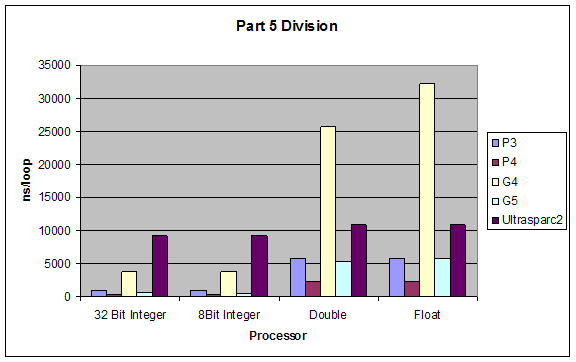
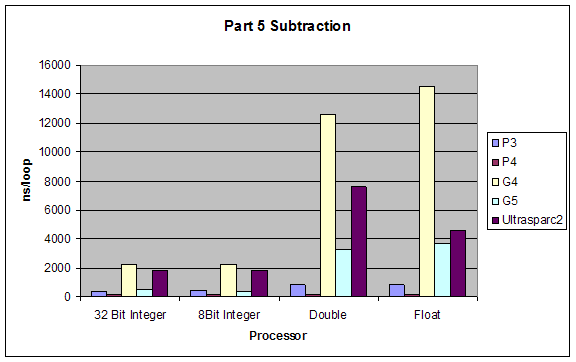
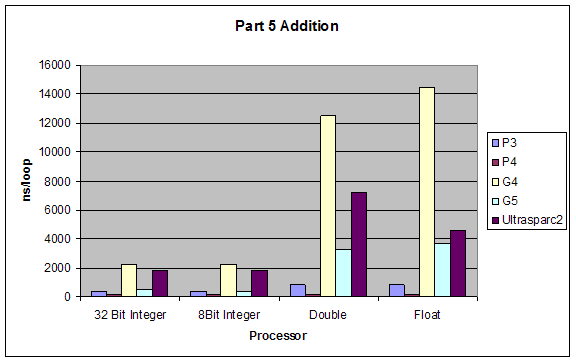
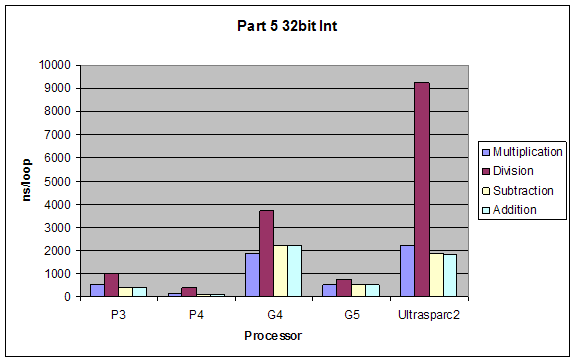
addition > subtraction > multiplication > division
The performance using different data types would by inversely proportional to complexity of type, so from better to worse it would be:
8bit integer > 32bit integer > single-precision float > double-precision float
Results:
Although our results were pretty much as expected, we did not expect such a dramatic performance difference between division and all other performances. Also addition and subtraction were closer to each other than we expected, but still addition performed slightly better.
Multiplication |
|
|
|
|
Processor |
32 Bit Integer |
8Bit Integer |
Double |
Float |
P3 |
501.4 |
468.5 |
839.2 |
838.5 |
P4 |
167.7 |
148.8 |
184.4 |
184.5 |
G4 |
1853.5 |
1854.1 |
9962.5 |
14125.7 |
G5 |
501.3 |
357.4 |
3106.7 |
3635.4 |
Ultrasparc2 |
2238.8 |
2253.7 |
7498.8 |
4576.6 |
Division |
|
|
|
|
Processor |
32 Bit Integer |
8Bit Integer |
Double |
Float |
P3 |
980.2 |
966.1 |
5846.6 |
5846.7 |
P4 |
411.8 |
413.6 |
2329.4 |
2335.5 |
G4 |
3723.1 |
3719.7 |
25726.1 |
32170.4 |
G5 |
737.5 |
617 |
5278.7 |
5782.7 |
Ultrasparc2 |
9252.7 |
9265.9 |
10886.8 |
10891.9 |
Subtraction |
|
|
|
|
Processor |
32 Bit Integer |
8Bit Integer |
Double |
Float |
P3 |
412 |
422.1 |
837 |
830.1 |
P4 |
138.4 |
137.5 |
177.6 |
178.4 |
G4 |
2245.7 |
2236.5 |
12629 |
14526.2 |
G5 |
514.4 |
386.5 |
3248 |
3667.2 |
Ultrasparc2 |
1859.9 |
1847.3 |
7576.2 |
4576.7 |
Addition |
|
|
|
|
Processor |
32 Bit Integer |
8Bit Integer |
Double |
Float |
P3 |
407.7 |
408.2 |
837.2 |
815.2 |
P4 |
138.2 |
137.4 |
178.6 |
178 |
G4 |
2225 |
2234.7 |
12520 |
14472.1 |
G5 |
514.2 |
380.3 |
3249.5 |
3693.1 |
Ultrasparc2 |
1840.8 |
1842.2 |
7226.3 |
4577.4 |
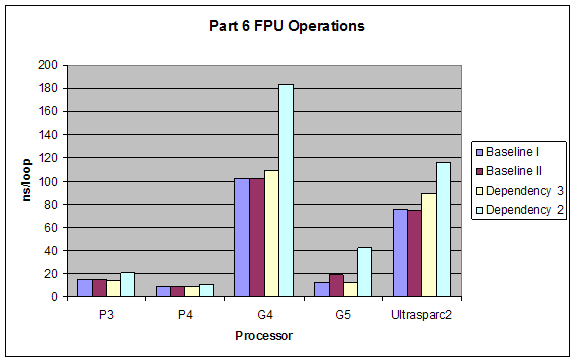
2.6 Superscalar Tests
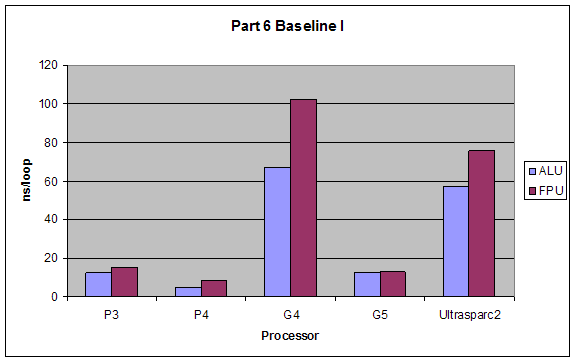
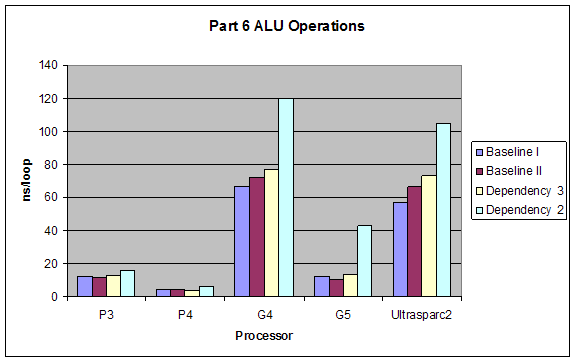
We tested the superscalar processing properties of different processors by introducing different dependencies into the code we put into our loops. All dependencies were tested once with using the ALU (integer calculations) and once with FPU (floating point calculations). Types of dependencies we tested were (taken exactly from lab website):
1. Baseline I: No dependencies at all, just add constants to operands, or add operands so that each operation is independent. something like:
a = a + 4;
b = b * 2;
c = c / 2;
d = d - 3;
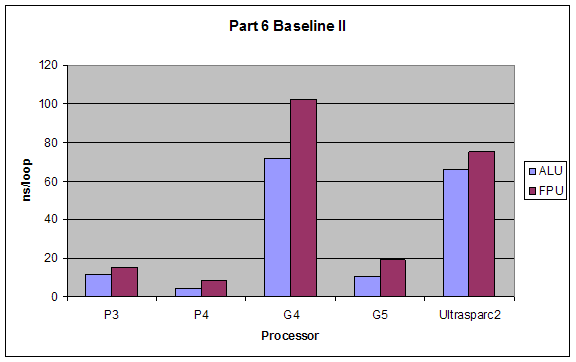
2. Baseline II: Operation four is dependent upon operation 1. Something like:
a = a + 4;
b = b * 2;
c = c / 2;
d = a - 3;
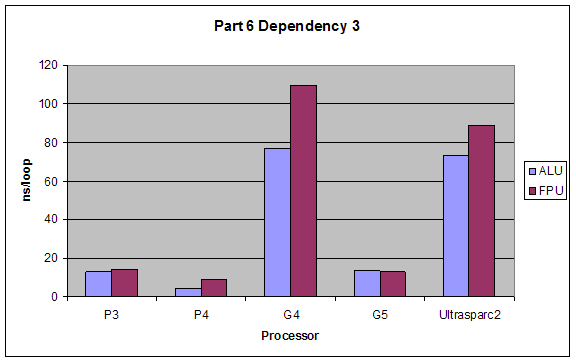
3. Dependency 3: Operation three is dependent upon operation 1:
a = a + 4;
b = b * 2;
c = a / 2;
d = d - 3;
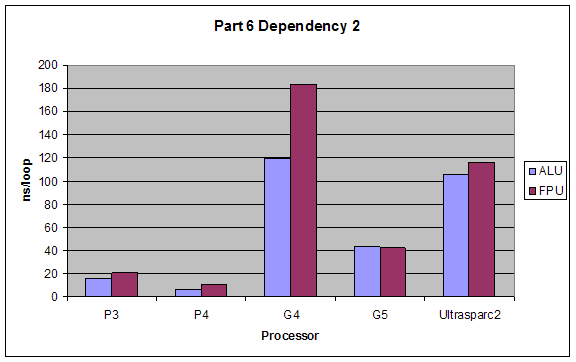
4. Dependency 2: Every operation is dependent upon the previous one:
a = a + 4;
b = a * 2;
c = b / 2;
d = c - 3;
We established the dependencies by relating different variables to each other through addition and subtraction, for example x=y+2 makes the calculation of x dependent on y.
Expectations:
The performance of Baseline I would be best since it takes full advantage of the superscalar architecture. Baseline II and Dependency 3 would have close performance since they hinder superscalar capabilities minimally. Dependency 2 would have the worst performance since it forces serial processing of the operations.
ALU would have better performance than FPU, and the dependencies’ effects would not change for using ALUs or FPUs.
Results:
Our results were exactly as expected.
3. questions.
- How did you implement the cache stress programs and how do you quantify the effects of having a cache?
Implementation is explained under Part 2.3. The effect of having a cache can be seen by comparing performance in sequential cache access and performance when processor is forced to miss cache accesses. In latter case time, is lost by going to one higher level of cache, and performance loss is evident.
- How did you implement the superscalar test programs and how do you quantify the effects of having a superscalar architecture?
Implementation is explained under Part 2.6. The benefit of superscalar processing can be made evident by comparing the performance of processing independent instructions with instructions that depend on each other. Independent instructions can be processed simultaneously taking advantage of the superscalar architecture, whereas inter-dependent instructions need to be processed serially and prevent usage of superscalar architecture.
- How might what you learn in this lab affect your programming style in the future?
From now on when handling large arrays of values we will try to access memory in sequential manner without performing frequent large jumps. Also when dealing with 2-d matrices we’ll try to use column major access since it provides slightly better performance. We’ll try to use division in algorithms as little as we can. And finally we’ll try to create as little dependency in our code as possible to allow for parallel processing.
4. extensions.
as an extension we tested on 5 processors and did a graphics test.
The graphics test involved drawing 5000 lines from between "random" points and "random" colors. We wanted to know how the procssors would handle, memory allocation, floating point operations, memory allocation and freeing memory as well as generating random numbers. It was very surprising for us that pentium family processors came up with the same random numbers (this was also true for the g4 and g5). Although the speed was increased in both cases in newer processors, the images didn't change, which means the way the seeds are used in the numbers haven't changed (maybe they haven't made any changes to LFSRs and it might actually be possible to figure out what kind of LFSR they are using by observing the pattern). the image created by UltraSparcII was very similar to the pentium images, but slightly different.
click on the images to see larger versions. the original images are 'ppm's but we converted them to gifs for web purposes.
PROBLEMS ENCOUNTERED
we had problems with p4 testing, for some reason it was extremely hard to stress p4s, and stressing the L2 cache didn't work well either because then baseline I was much faster than baseline 2 because of the L1 cache and we couldn't make comparisons.
when a web browser was open, the tests seemed to be effected a lot in a few cases, but that makes sense.
also, the g4 and the g5 were slower than we expected. we think that the programs running in the background affected the G4 and G5 tests.
5. discussion / what we learned.
* we learned a lot about the cache systems of different processors and their performances.
* although we expected g5 to be faster Pentiums seemed to be better. From daily experience we know that G5 is great with image manipulation and mathematical calculations (MATLAB and Photoshop run faster with G5) but P4 dominated almost all tests.
* usually row-major operation on 2D arrays are faster than column-major operations, so from now on we'll try to use the non-conventional method of accessing arrays in row-major order. we also learned that we should be careful about choosing array sizes and accessing the elements in the array.
*overall, P4 seems to be the best processor. we expected the G5 to outperform P4 with graphics and floating-point operations but it didn't happen. We will stop complaining about our P4 procssors but will secretly still want to have G5s.
*UltraSparc II was faster than we thought it would be, but it's still very slow.
|