Directed Graphs

So far, we have been representing instances of the stable marriage problem simply by describing them. Is there a more efficient way to represent the problem? It would be particularly useful to find a representation that is amenable to computer computations. Balinski and Ratier, [BM1] among others, choose to represent stable marriage problem instances as directed graphs. Consider an instance of the stable marriage problem with n men and l women. As was discussed before, it is not necessary that a stable marriage instance contain the same number of men and women, although in such a situation not every person will be matched. Let the men and women rank each other, with each man leaving off his list only women who are so objectionable to him that he would rather be single than with one of them, and let the women do the same for the men. Let G be a directed graph with n*l vertices, one corresponding to each potential couple, with the vertices placed on a n by l grid. So if m, m’ are men and w, w’ are women, G will include vertices (m, w), (m, w’), (m’, w) and (m’, w’) in the configuration shown in figure 1.

The vertices in figure 1 represent the possible couples. Vertex 1 represents (m, w), vertex 2 represents (m, w’) and so on.
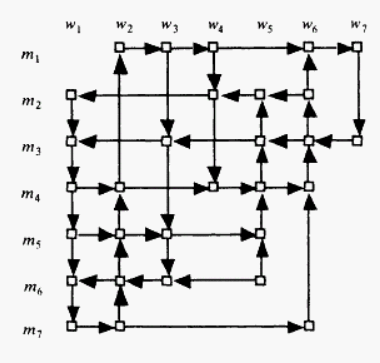
We can add arcs to this graph to represent the preferences of the stable marriage participants. A vertical arc (in figure 1 an arc going in either direction between 1 and 3 or 2 and 4, in either direction) represents the preference of the woman at the head of the column. If, for example, woman w prefers man m to man m’, we will draw the arc arc (3, 1) in the picture in figure 1. Similarly, horizontal arcs represent the preferences of the men. In a stable marriage instance with more than two participants of each gender, there will be an arc between every pair of ranked men in any woman’s column, and similarly for every man’s row. The majority of these arcs are superfluous, however, since preference is transitive. So we can delete any arc implied by transitivity, and determine the preference order by examining the path from the least to most preferred in each column or row. A vertex may have a degree as high as four. A vertex with higher indegree than outdegree represents a couple that is popular with both genders, while one with higher outdegree than indegree represents a couple that is less popular. Figure 2, from Balinski and Ratier in 1998, shows the directed graph for a stable marriage problem instance with 7 men and 7 women. I’ve added a possible preference list for clarity. Note that not every possible couple has a vertex in the graph. The vertex can be omitted if either the man in that row or the woman in that column did not rate the other. No pair in which one participant finds the other so undesirable that he or she would rather be single could possibly be part of a stable marriage, so it does us no good to consider it.
Preferences:

man m1 m2 m3 m4 m5 m6 m7
1st choice w7 w1 w1 w6 w5 w4 w6
2nd choice w6 w3 w3 w5 w3 w1 w5
3rd choice w4 w4 w4 w4 w2 w2 w2
4th choice w3 w5 w2 w2 w1 w3 w1
5th choice w5 w6 w5 w1   w6  
6th choice w2   w6     w5  
7th choice     w7        


woman w1 w2 w3 w4 w5 w6 w7
1st choice m7 m1 m6 m4 m2 m1 m3
2nd choice m6 m4 m5 m2 m3 m2 m1
3rd choice m5 m5 m3 m1 m4 m3  
4th choice m4 m6 m1   m5 m4  
5th choice m3 m7     m6 m7  
6th choice m2       m7    
7th choice              


[BM1]
As demonstrated on the next page, the graph constructed from a stable marriage instance allows us to use the tools of graph theory to search for proofs and algorithms relating to the stable marriage problem.


contents